Gainsight for IT and Analytics Teams
Better serve your business by giving every team the customer insights they need for action.
Trusted by Leading Brands




Eliminate Silos and Consolidate Your Data
Maximize efficiency with a single source of truth for customer data. Your team will have less applications to manage and your company will benefit from streamlined workflows and direct access to the data they need.
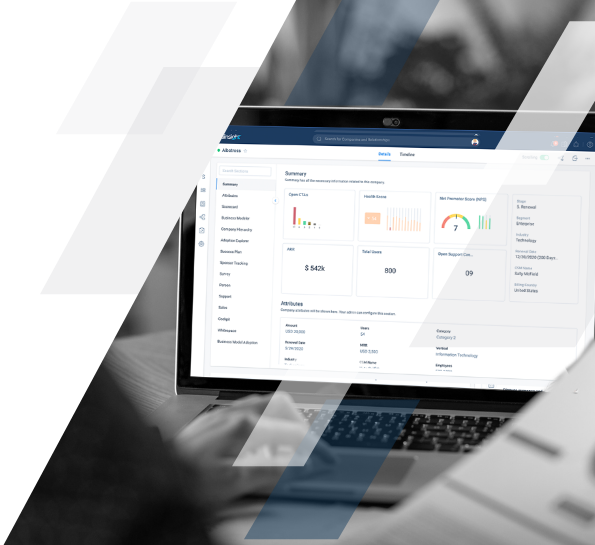
Align stakeholders with a single view of the customer.
-
Finally standardize all parts of your business on one shared definition of the customer
-
Give every team within your business the flexibility to own the piece of the customer that matters to them without breaking a centralized definition
-
Present the relevant perspective – and only the relevant perspective – of the customer to each team across your business
Leverage a pre-built database architecture.
-
Represent all the ways your company does business with a customer without building a customer model from scratch
-
Integrate your data into a platform that was built to handle customer data in all its formats; from batched CRM data to streaming product telemetry data and everything in-between
-
Don’t recreate the wheel by designing a customer database architecture – rather focus on extending an existing purpose-built architecture for your organization
Automate insight generation, without a line of code.
-
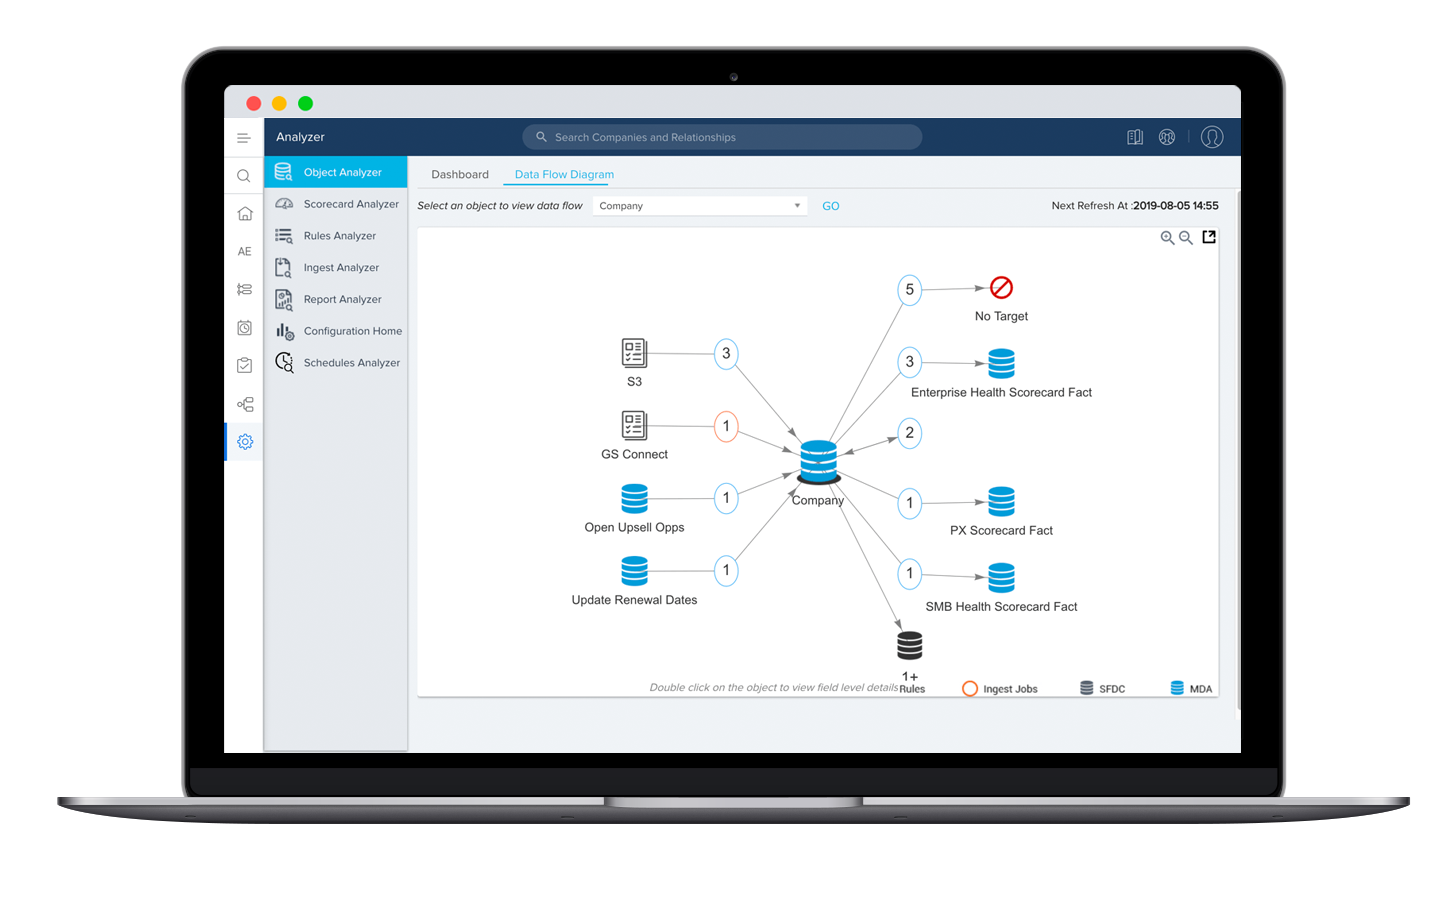
Automate data preparation processes with a point-and-click engine that can conduct over 15 types of transformations on large volumes of data, all through in-memory processing
-
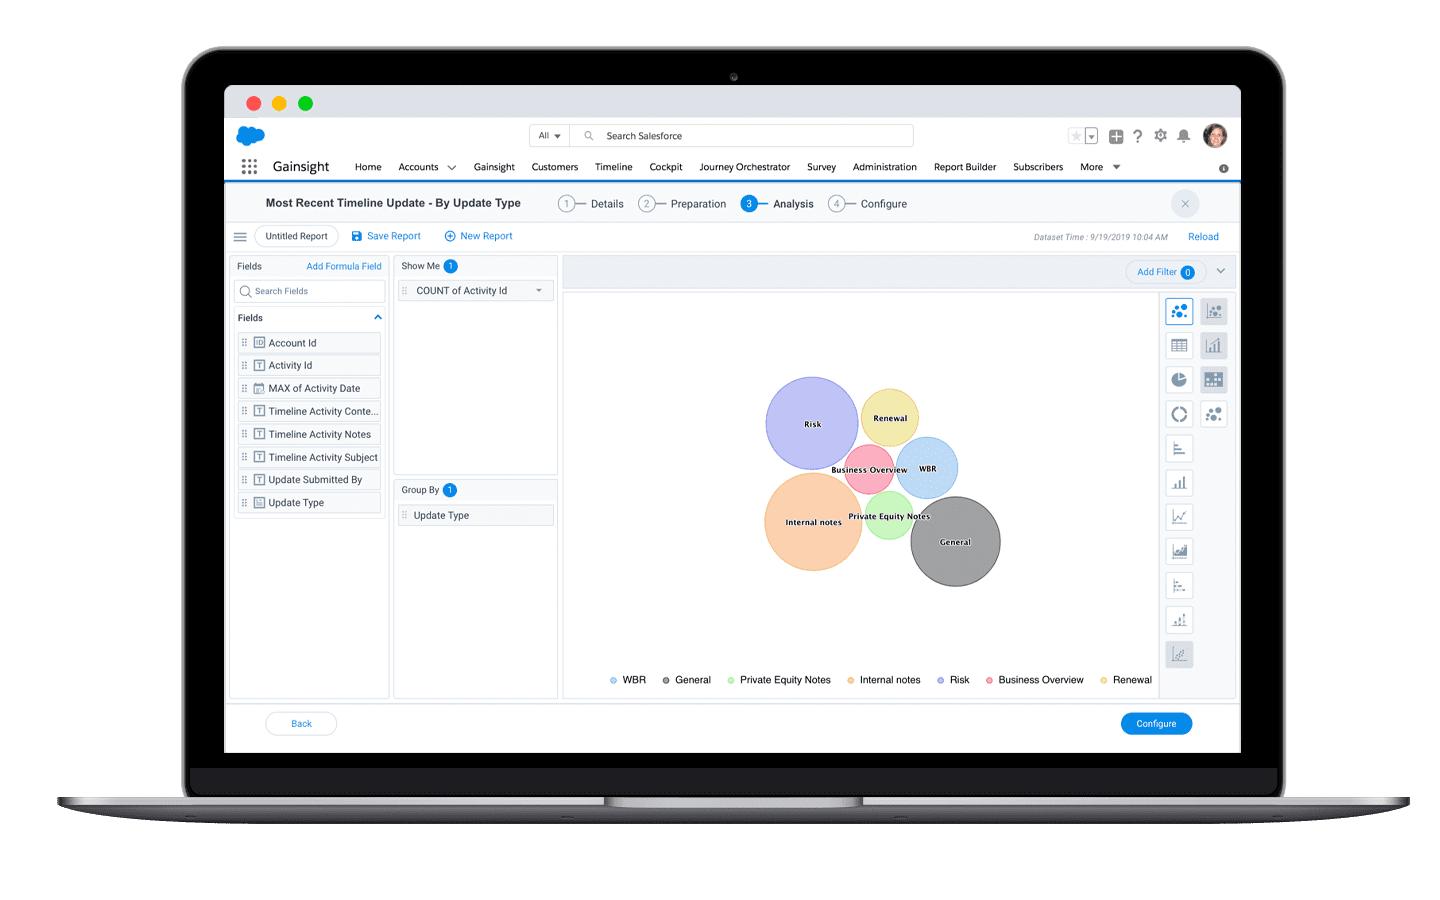
Explore and validate your data through a graphical interface that can combine and visualize different data sets to make it easy to prepare data for use by the business
-
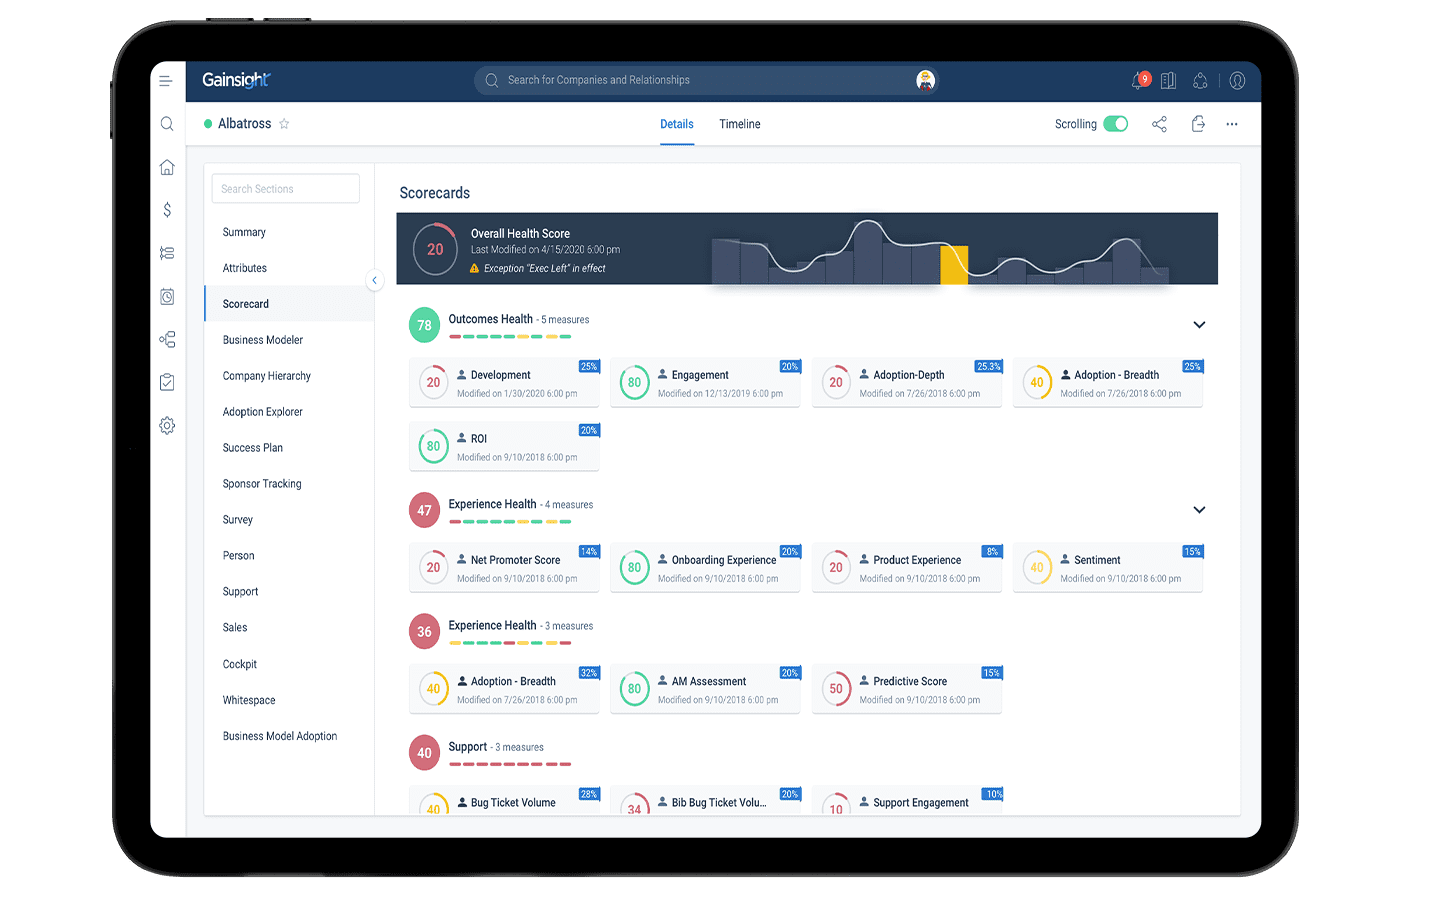
Design and automate a scorecard that translates trends in data to indicators of customer health
Additional Resources
Sanders Slavens, Plex’s VP of Customer Success, sat with Gainsight’s CEO, Nick Mehta, and CCO, Ashvin Vaidyanathan, to discuss their progress in reducing friction and…
It's the golden metric of the subscription business model. But how do you calculate it? How do you predict it? And how do you grow…
