We had a big board meeting this quarter where we not only covered the past quarter’s “state of the union” and metrics, but also plans for the next year.
In the spirit of drinking my own champagne (I prefer champagne to Kool-Aid any day!), I wanted to leverage my instance of Gainsight to prepare the deck for the board meeting. But this was more than a vanity project—it might not have been impossible to do this task without Gainsight, but I can’t imagine how I would have done it. If you’ve ever presented before your company’s board, you know how stressful it can be. I had a few sections to talk about the Customer Success team, and Gainsight put all the information at my fingertips and saved me from crunching spreadsheets for hours.
Register for a webinar on how Ashvin prepares his board presentation
Call me biased, but if you’re a CS leader, you need to use it. Here’s what the deck looked like (numbers are all sanitized of course):
1. How we did in the previous quarter
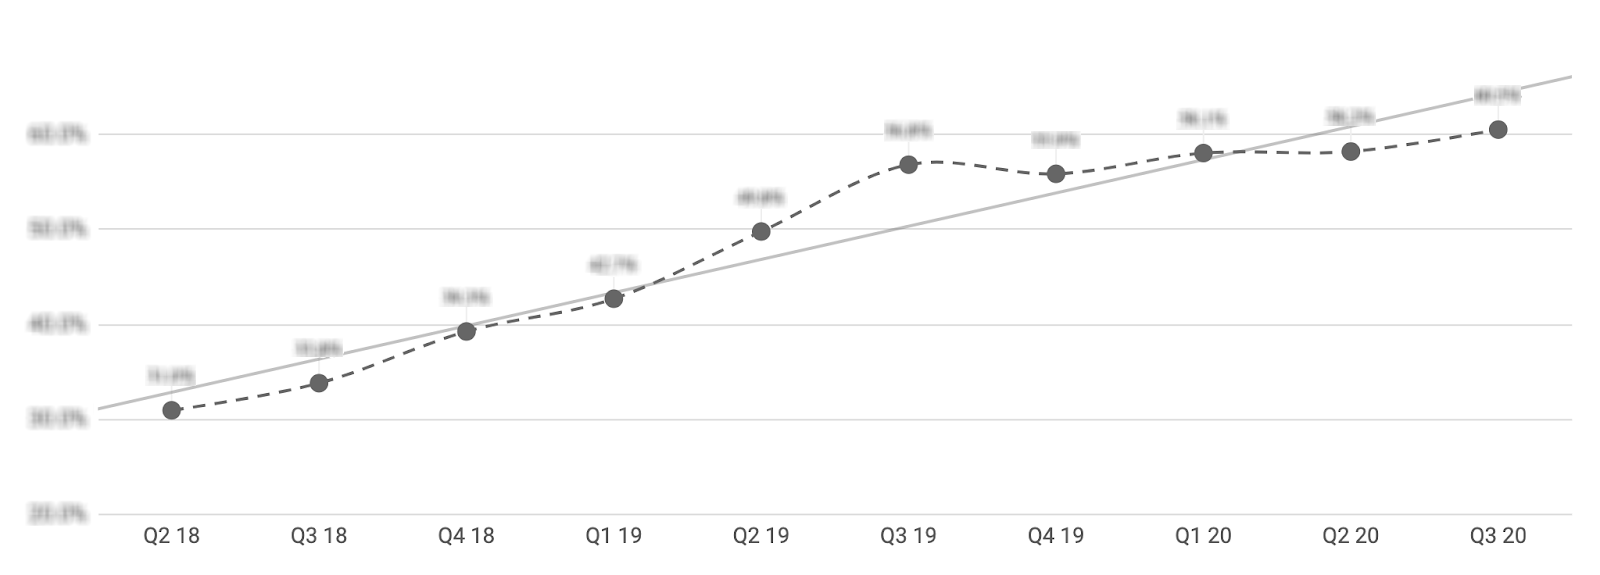
I started off by showing the trend in Active User Growth over time pulled straight from Gainsight.
We then spoke about how the Top 20 Customers (by Annual Recurring Revenue) were doing in terms of health measured by our DEAR Framework:
- Deployment: Are customers assigning/consuming all the licenses they are entitled to?
- User Adoption: Are CSMs at each customer using Gainsight in a healthy way (based on logins)?
- Breadth of Adoption: Are customers using multiple parts of the product?
- Engagement: Are we talking to the main personas at each customer every quarter?
- ROI: Are customers achieving outcomes from Gainsight?

We had launched a program last year called “Verified Outcomes” in which we track the percentage of customers where the decision maker has acknowledged outcomes or value. We showed how the metric has been trending over time.

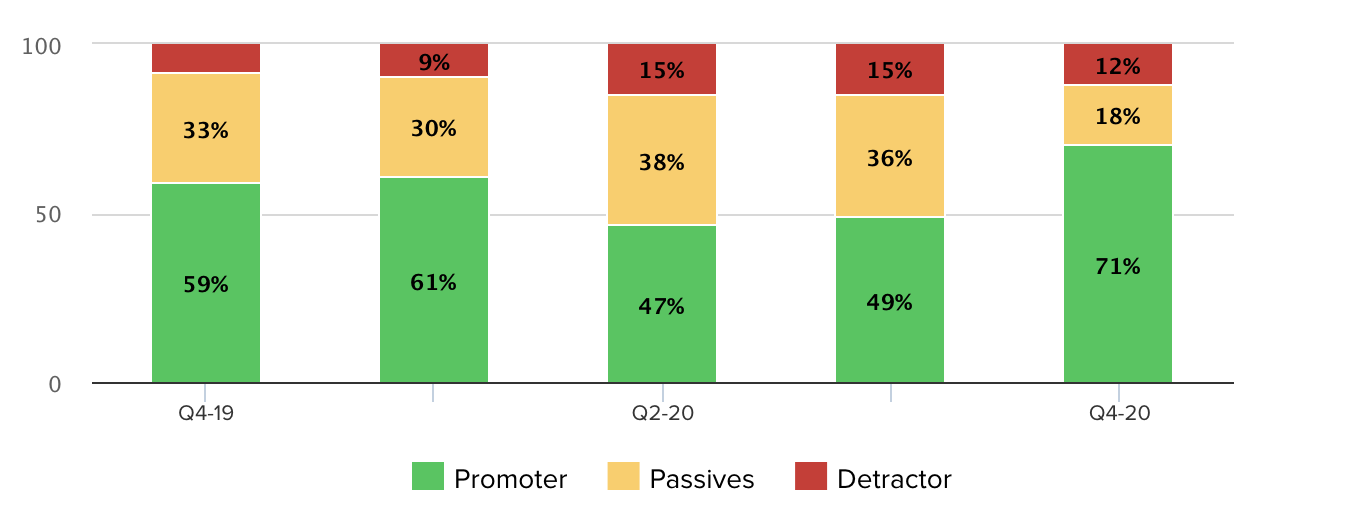
Finally, we spoke about Customer Experience working with Gainsight as measured by Net Promoter Score.
2. Next FY Planning: Rethinking Segmentation
This year, we segmented our customers based on their current spend and their employee count. While that’s very useful for thinking about account loads and operations, it’s not necessarily aligned to growth. It’s also a more “inside-out” way of thinking about your customers. Next year, we want to focus our energies on:
- Maximizing potential expansion in the customer base.
- Making sure we serve customers the way they want to be served.
But how do you go from broad values-oriented or strategic thinking to actually making real-world changes? To understand which customers should be a focus for expansion, I looked at two factors:
1. ARR Penetration
-
Definition: Ratio of current ARR/Number of Employees
- Low = Less than $X/employee
- High = Greater than $X/employee
In this factor, lower numbers are preferable and indicate potential whitespace for expansion.
2. Health Score
-
Definition: Average of Deployment (Are customers assigning/consuming all the licenses they are entitled to?) and Adoption Scores (Are CSMs at each customer using Gainsight in a healthy way?)
- Low = Orange or Red Health (less than 60)
- High = Yellow or Green Health (more than 60)
In this factor, higher numbers are preferable and indicative of current value.
We took those two factors and plotted them on a two-by-two graph to help us identify the optimal target customers for driving expansion.
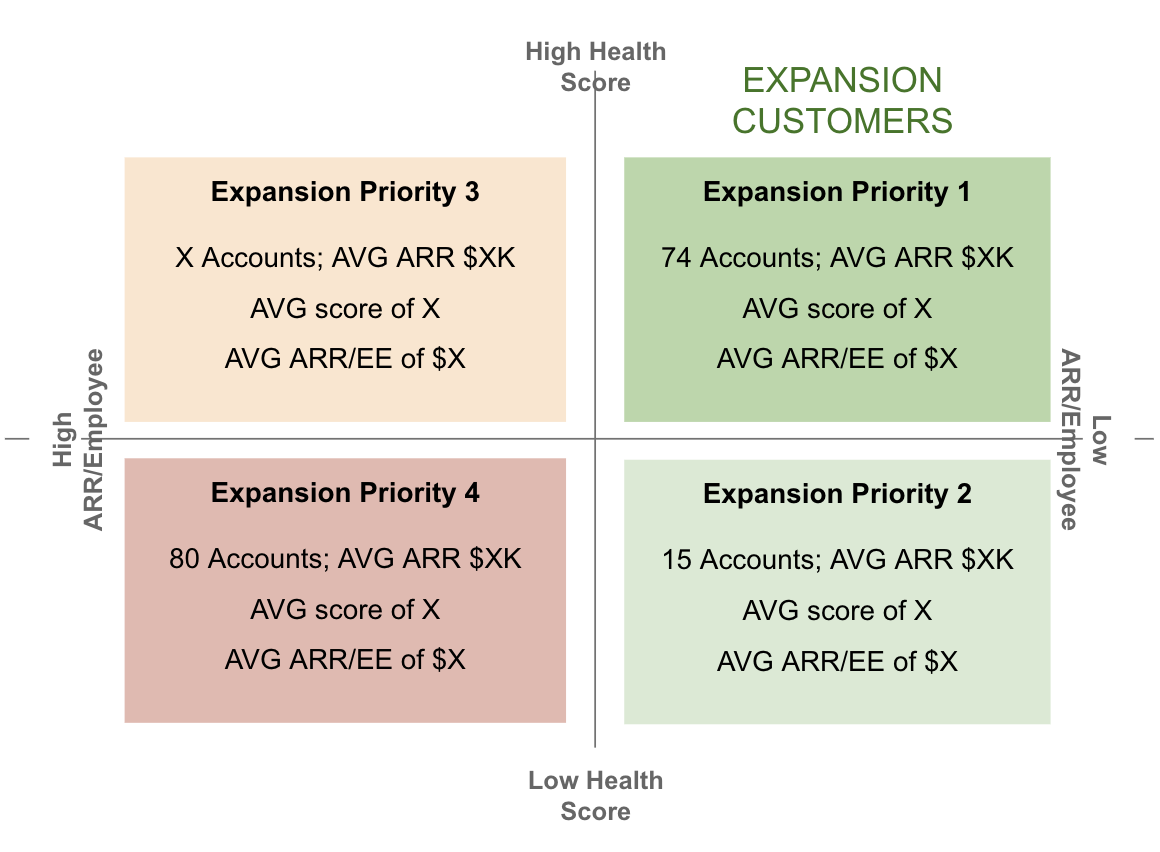
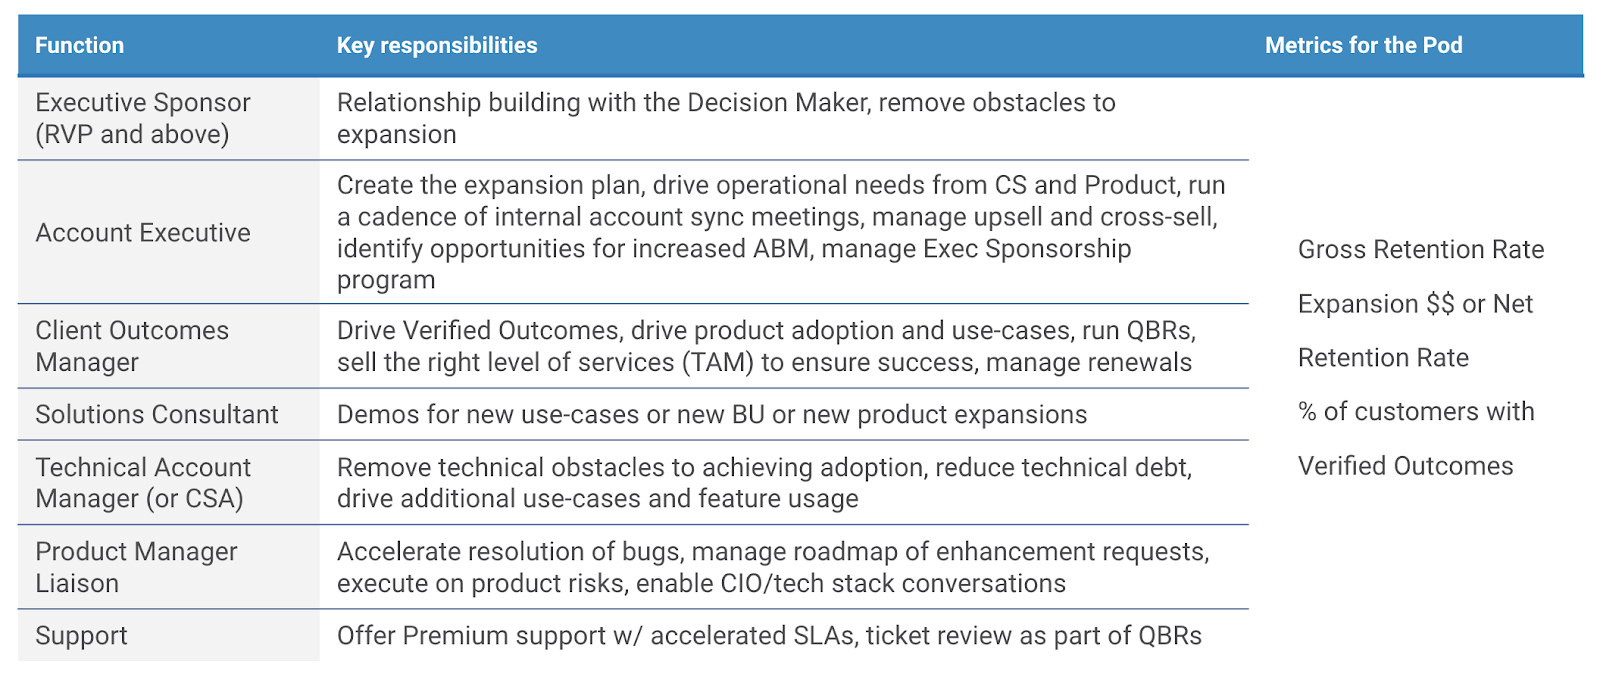
These expansion customers basically become the “Growth” segment for next year where we plan to create “pods” that include CSMs, Account Executives, and other roles we want to work more closely together on a pool of expansion accounts. Here’s a rough draft of the roles and responsibilities for the different teams in a pod.
3. Next FY Planning: Rethinking Leading Indicators
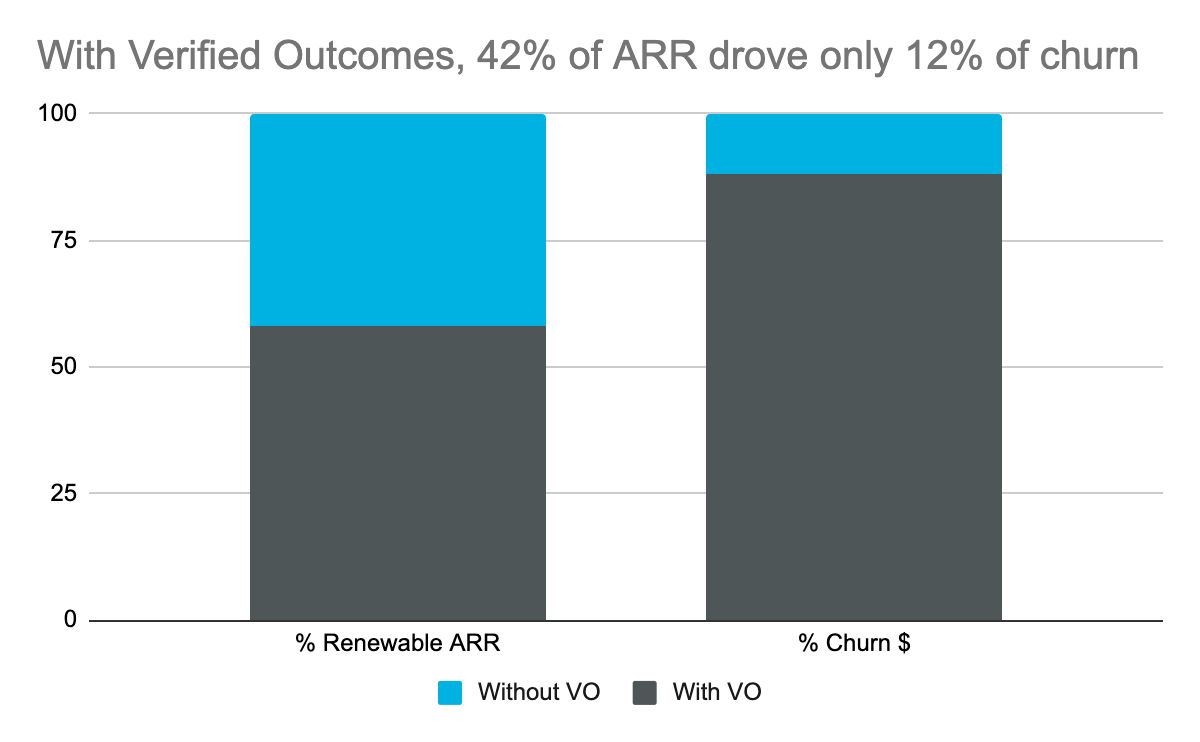
Many Customer Success orgs are now moving from pure activity or adoption metrics to focus more on “outcome” metrics. At Gainsight, we adopted the notion of compensating and measuring our Client Outcomes Management (a.k.a. CSM) team based on “Verified Outcomes.” We ask the COM to verify in writing with each customer what business outcomes have been achieved. We’ve been running the program for the past 12+ months and saw that customers with Verified Outcomes (VO) tend to renew at 16% points higher than customers without!

Also customers with Verified Outcomes made up 42% of ARR but only 12% of the dollar churn!
But whether outcomes are achieved isn’t just the job of CSM—we know that other functional teams have a huge impact on outcome delivery. What if we could generalize the impact of the VO leading indicator to the entire lifecycle?
In the next FY, we want to make this process end-to-end throughout the customer journey to reflect the “outside-in” mentality I mentioned earlier. Within Gainsight, we have three teams aligned to three phases in the lifecycle: Sales, Professional Services, and Client Outcomes. But from the customer’s perspective, what are the milestones they need to achieve to hit to achieve the outcome they desire with our product?
We know that getting from milestone to milestone is much easier (from our perspective) when it’s contained inside a single phase/function. Let’s use Sales as an example. From the customer’s perspective, they engage with our team to:
- Talk strategically about their business needs and goals, and then…
- Tactically plan out the processes and technology they’ll use to achieve them.
When we align those touchpoints to our internal Sales roles and process, they naturally fall to the 1. Account Executive (AE) and 2. Solutions Consultant (SC) (respectively) who naturally work in deep alignment together on any given account.
So far so good. From the customer’s perspective, the handoff between AE and SC is so fluid, it might not even exist. But what about going from Sales to Professional Services? And then from Services to Client Outcomes? We want to make those handoffs just as fluid from the customer’s point-of-view. To do that, we need each team to use a common language to efficiently align their work.
To explain, here’s what I presented to the board:
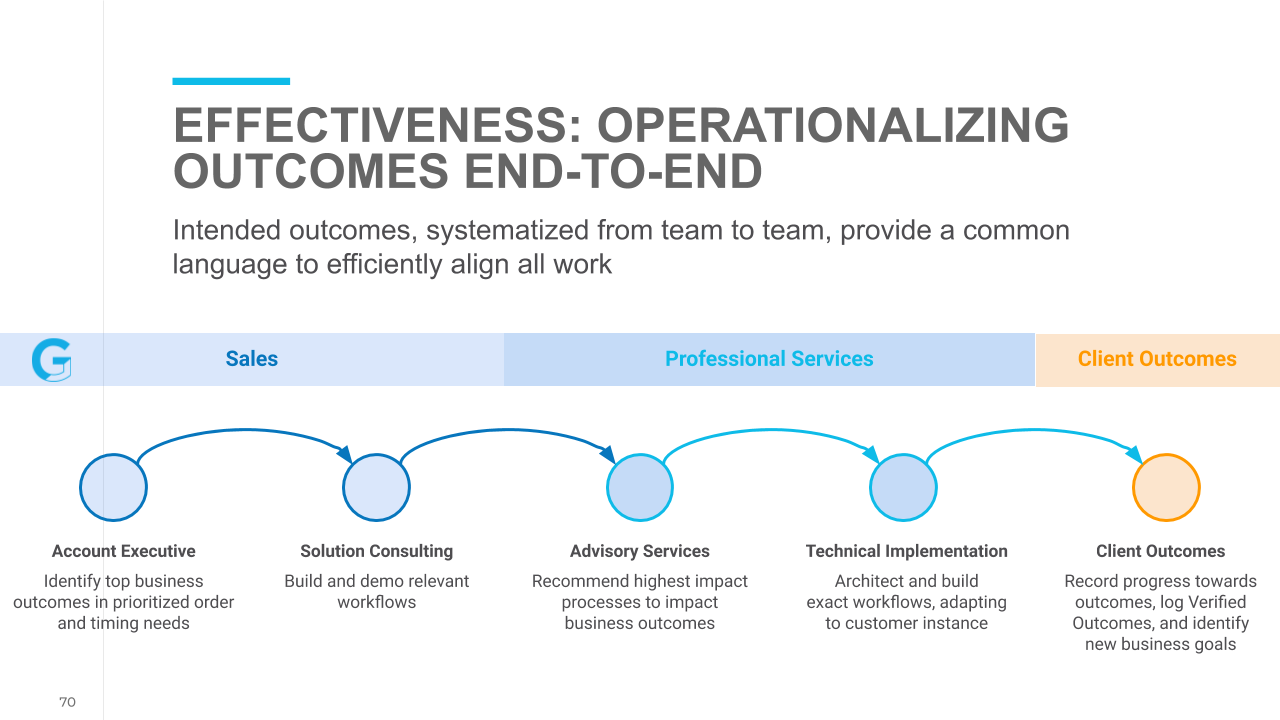
As you can see, every person in this “pod” is either capturing, operationalizing, or verifying the customer’s outcome at each milestone. But let’s drill down a bit more, again starting with Sales. In each Salesforce Opportunity, we want to expand on the information our team is capturing to include outcomes and baseline ROI metrics. We use a framework that acronyms to MEDDICC:
- Metrics: What are the customer’s baseline metrics? (For us, it’s often Retention)
- Economic Buyer: Who are the key decision makers on the Account?
- Decision Criteria: Why did they choose Gainsight? (Usually a 1-2 sentence qualitative statement)
- Decision Process: What happened (or still needs to happen) for Closed-Won?
- Identify Pain: What are the main problems we’re trying to solve? (Perhaps efficiency, retention, and upsell?)
- Champion: Who’s most directly responsible at the customer for solving these?
- Compelling Event: What is the “burning platform” to cement this relationship? (Quarter-end? A price threshold?)
Subsequently, Professional Services has a mandate to drive specific outcomes using pre-built, best-practice configurations. These are naturally operationalized in Gainsight. 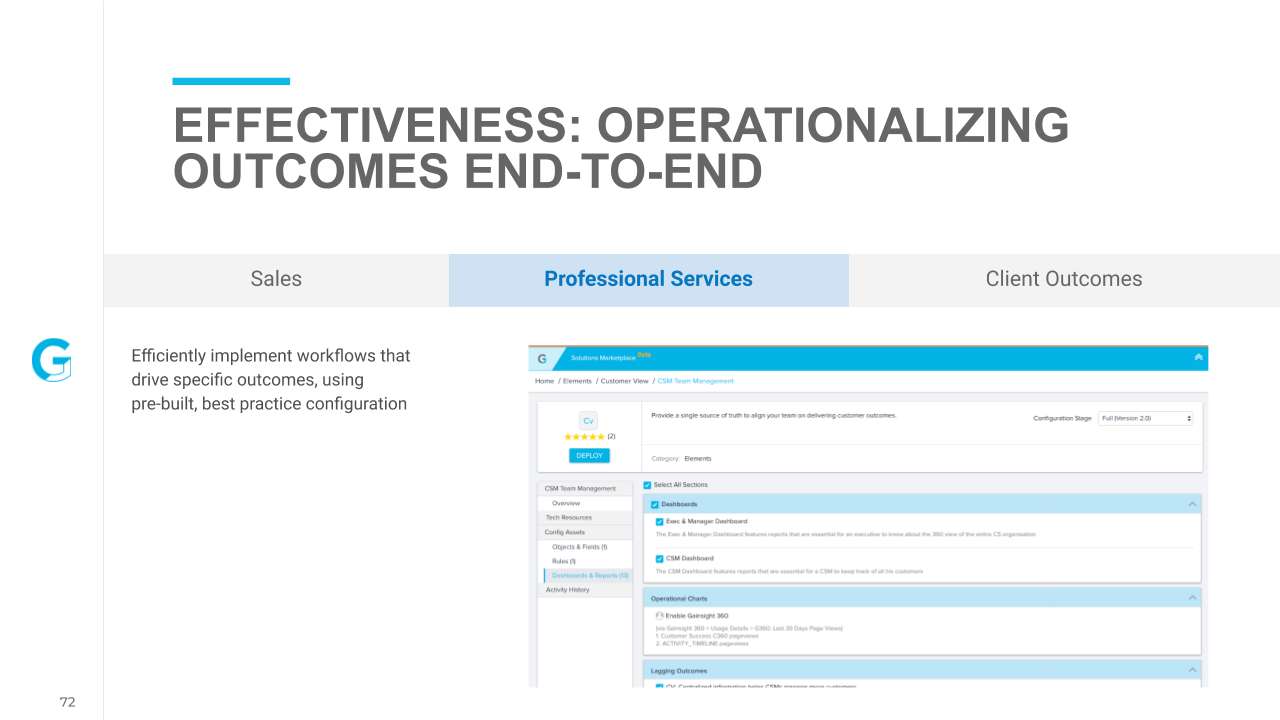
And lastly, Client Outcomes (as we detailed above) are driving outcomes day-to-day and verifying them using Success Plans.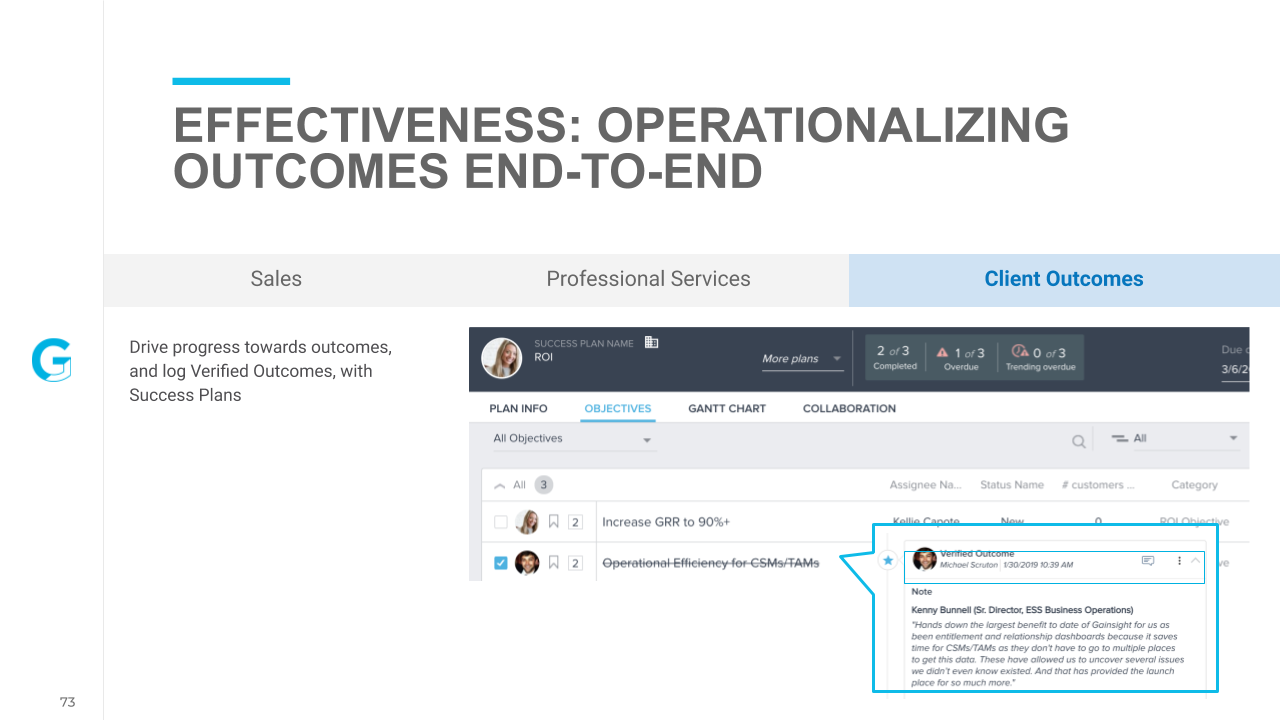
—
There’s a recurring subtext to both my board presentation as well as this blog that I’d like to make text. An effective framework for making positive change follows a general three-step process similar to what I showcased to our board:
- Looking back to understand where you are now.
- Looking ahead to see where you want to go.
- Planning how you will get there.
Obviously that leaves out Step Four—actually doing it! But I do want to point out that most leaders I talk to spend an inordinate amount of time on the first two steps and end up forced to kick the actual planning (and therefore the execution, as well) down the road.
In my process, I spent the least amount of effort on the first two steps. Our benchmarks are meticulously tracked and easy to access and visualize in Gainsight. Furthermore, gleaning insights is likewise easy to do. If you’ve already conducted your year-end board meeting, you may have had a different experience—slogging through spreadsheets, copying and pasting screenshots into slide decks, and overall spending way too much time looking backwards.
If you think it’s too late, now you’ll need to wait until next year to start generating these kind of benchmarks and insights, that means it could be 18 months or more before you start realizing the value. But obviously, it’s not too late.
Click here or leave a comment below and I’ll get you in touch with the right person on my team to understand your pain points and goals so we can get you on track.
